Demystifying Estimated Muscle Fatigue: How SwiftMo Tracks Neuromuscular Depletion
Traditional fitness apps treat training as a static spreadsheet: do 3 sets of 10 reps, rest 2 minutes, and repeat. But your body is a dynamic biological system. On some days, your muscles recover rapidly; on others, fatigue lingers.
To bridge this gap, SwiftMo features an Estimated Muscle Fatigue engine (currently in Alpha). It provides a real-time, visual heatmap of your muscular status, allowing you to optimize volume and autoregulate your workouts.
1. The Core Concept: Neuromuscular Tracking
Estimated Muscle Fatigue does not just track the workouts you log—it models how individual muscle groups (like your quadriceps, chest, or obliques) respond to work.
By tracking concentric power drop-offs, eccentric control loss, and peak velocity, the engine estimates the metabolic and mechanical stress placed on each muscle group.
2. How the Algorithm Works: Bayesian Updating
Instead of using a simple "work-in, fatigue-out" formula, SwiftMo models fatigue using a Bayesian State-Space Framework. Here is a high-level view of how it operates:
- The Prior (Your Baseline): The algorithm maintains a "prior belief" regarding the fatigue state of each muscle group. This prior is continuously updated based on your age, profile, and historical performance.
- The Observation (Workout Set): When you perform a set, you feed the engine new physical observations (e.g., a 15% drop in peak concentric power).
- The Bayesian Update: Using probability distributions, the algorithm combines the prior state with the new observations to perform a Bayesian update. This calculates a new, highly personalized posterior state representing your current fatigue:P ( Fatigue State | Workout Observations ) ∝ P ( Workout Observations | Fatigue State ) × P ( Fatigue State )
- The Recovery Decay: During periods of rest—both the minutes between sets and the hours between workout sessions—the algorithm applies a physiological decay curve. This models how your muscles clear waste products and repair micro-tears over time, gradually sliding the fatigue level back toward baseline.
NOTE
Because the algorithm relies on updating statistical priors, it requires a baseline period of 3 to 5 sessions to accurately calibrate to your individual neuromuscular profile. Initially, values may appear higher or lower than your subjective feel.
Bad data can completely throw the algorithm, at the minute no option exists to prune inputs, only reset the values which reset with time anyway, just as the body recovers.
3. Visualizing Your Fatigue Heatmap
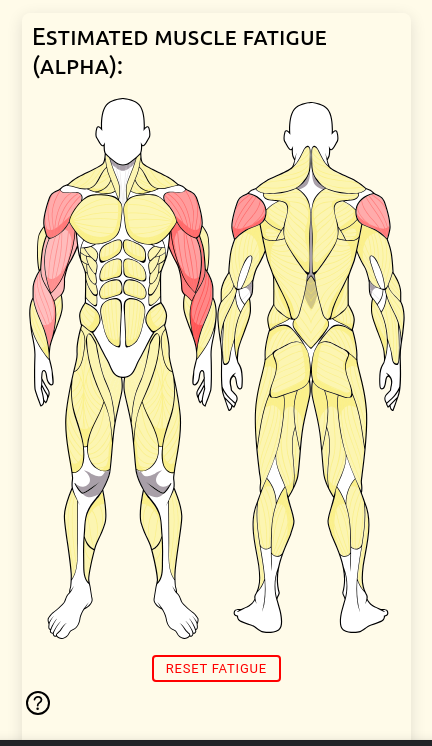
The estimated fatigue is plotted directly onto a front-and-back anatomical muscle diagram in your dashboard:
- 🟨 Yellow (Transparent/Light): Fresh / Baseline. The muscle group is fully recovered and primed for maximal force production.
- 🟥 Red (Vibrant/Deep): Fatigued. The deeper the red shading, the higher the estimated fatigue level (close to 1.0).
4. Practical Application: Autoregulation
You can use the fatigue heatmap to make smart, real-time decisions about your training:
- Target Fresh Muscles: If your quadriceps are deep red, but your glutes and hamstrings are yellow, prioritize hip-hinge movements (like deadlifts) over knee-dominant movements (like squats).
- Manage Weekly Volume: If multiple muscle groups remain shaded red after consecutive days of training, it is a clear sign to schedule a active recovery day or a deload set.
- Resetting the Prior: If you take a long break or feel completely recovered but the system shows lingering shading (due to a past anomalous data point), you can use the Reset Fatigue button. This resets the algorithm's priors back to baseline, allowing it to start learning your state fresh.