Demystifying Power Curves: The Physics of Velocity, Work, and Personal Bests
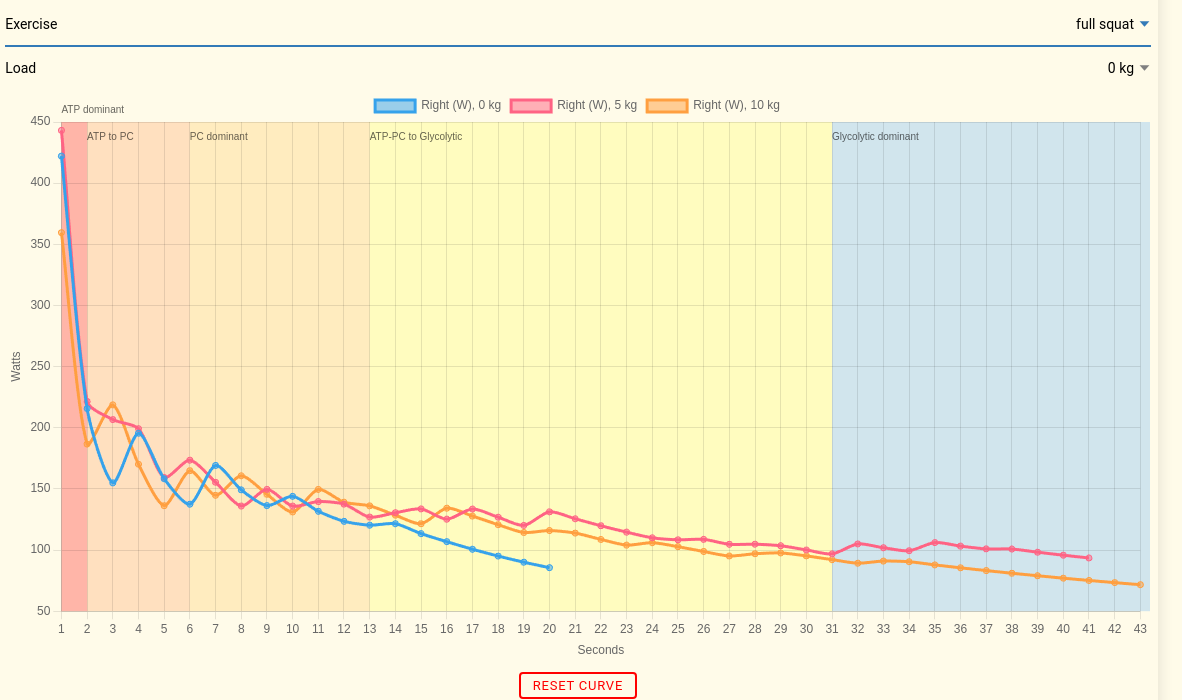
If you’ve spent any time looking at the analytics dashboard in the SwiftMo Power app, you’ve likely encountered a graph that traces a steady downward curve as duration increases. This is your Power Curve—a signature profile of your ability to generate force quickly over time.
But what actually happens behind the scenes to build this curve? How does a smartphone camera tracking your joints transform a live video feed into a precise measurement of mechanical power? And more importantly, how do you use this data to choose your weights and design your workouts?
Let's break down the physics, the math, and the training strategies behind power curves.
1. The Physics: From Keypoints to Watts
To understand how power curves are calculated, we have to start with basic Newtonian physics. Power is defined as the rate at which work is performed:
Power (Watts) = Work (Joules)⁄Time (seconds) = Force (Newtons) × Velocity (m/s)
2. The Math: Extracting the Curve
If you look at raw joint power over a set, it fluctuates wildly. You produce massive power as you accelerate the weight upward (concentric phase), absorb energy as you lower it (eccentric phase), and produce zero power when you pause between repetitions.
To turn this chaotic time-series into a clean, actionable Power Curve, the server processes the set data using a rolling-window algorithm:
Concentric-Only Focus
Because athletic power output is conventionally evaluated on the active lifting phase, we clamp all negative power values (eccentric deceleration) and rest intervals to 0. This isolates the energy you contributed to the load:
Concentric Power = Max(0, Power)
1-Second Time Buckets
To account for frame rate variations, the app integrates the frame-by-frame concentric power values over time to calculate the average power generated during each discrete 1-second block of the set.
The Rolling Max Window
A power curve maps your performance across different durations (e.g., 1s, 2s, 3s, ..., 16s). To extract this profile, a rolling window slides across the 1-second averages:
- To find your 1-second peak power, the algorithm finds the single highest 1-second average in the set.
- To find your 5-second peak power, it slides a 5-second window across the set, computes the average power within each window, and identifies the maximum.
- This is repeated for every duration up to the total length of the set.
Because it is easier to maintain high power for a split second than for a prolonged period, your curve will naturally decline as duration increases, producing a classic power-duration profile:
| Duration (s) | Sample Peak Power Output (W) | Description |
|---|---|---|
| 1s | 180 W | Instantaneous explosive drive |
| 5s | 120 W | Sustained power across a fast rep |
| 12s | 65 W | Average output across a high-effort set |
3. How to Use Power Curves in Your Training
Now that you know how the numbers are generated, let’s talk about how to apply them to your training.
A. Real-Time Progressive Overload (Personal Bests)
Instead of just counting reps, the app automatically compares the average concentric power of your active side against your historical personal best (PB) for that exact duration and weight.
- If you complete a set lasting 12 seconds and your average concentric joint power is 72W while your historical 12s PB at that weight is 70W, the app will flag a New Power PB!
- This lets you track progressive overload even if you don't add weight to the bar—simply moving the same weight faster or keeping rest times shorter increases your average power.
B. Fatigue Management and Auto-regulation
Your power output is highly sensitive to central nervous system (CNS) fatigue. You can use the percentage of your personal best to auto-regulate your workouts:
- 90% - 100% of PB: You are fully recovered and primed for high-intensity work.
- 80% - 89% of PB: Normal training zone. Cumulative fatigue is present, but manageable.
- Below 80% of PB: High fatigue indicator. If your power output drops significantly, your nervous system is tired. It is a sign to reduce the weight, cut the set short, or take an extra rest day.
C. Optimal Load Selection (The Power "Sweet Spot")
By tracking your power curves across different weights (e.g., curls at 10kg vs. 15kg vs. 20kg), you can identify your optimal load for power development.
- If your 1s peak power is 150W at 10kg, 180W at 15kg, and drops to 120W at 20kg because the weight slows you down too much, then 15kg is your optimal training load for generating maximum explosive power.
By shifting the focus from simple repetition counting to the dynamic rate of energy output, power curves offer a window into your nervous system and muscle recruitment, helping you train smarter, faster, and with scientific precision.