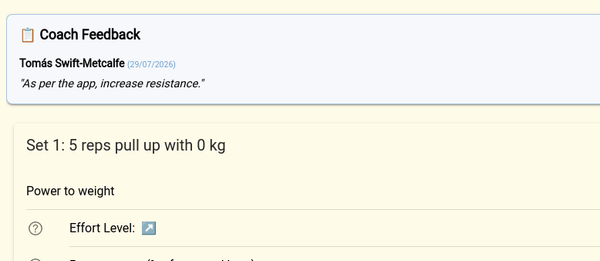
Understanding Performance Decay & Effort Level
In SwiftMo Power, tracking how much work you perform is only half the equation. To truly optimize your training, you need to understand how your body fatiguing behaves during a set. This is where Performance Decay (shown as Effort Level for colloquial profiles) comes in.
1. What is Performance Decay?
Performance Decay measures the rate of fatigue accumulation across the reps of a single set. Instead of relying solely on subjective feel (RPE), SwiftMo analyzes the velocity and force of every rep to determine exactly how your neuromuscular system is holding up under load.
- Calisthenics / PT Clinician: Displayed as Performance Decay (a numerical index).
- Home Trainer / Alt Tab: Displayed as Effort Level (mapped to friendly terms like Easy, Moderate, Hard, or Exhaustion).
While the value displayed is positive for "more performance decay", in order to capture the largely positive association or performance decay with training effect, under the hood these values are drawn from the slopes of the concentric and eccentric phases.
2. The Components of Decay
To understand the overall decay, SwiftMo breaks your reps down into three distinct movement phases:
Power Phase (Concentric) Decay
This measures the loss of concentric push and explosiveness during the lifting phase of the movement.
- Why it matters: A drop in concentric power indicates that your fast-twitch muscle fibers are fatiguing, making it harder to accelerate the weight.
Recovery Phase (Eccentric) Decay
This measures the loss of control during the yielding or lowering phase of the movement.
- Why it matters: In healthy training, you want to maintain a controlled eccentric phase. A rapid drop-off in eccentric power output indicates a loss of muscular control (yielding/dropping the weight too fast).
Peak Power Decay
This measures the drop in your absolute, instantaneous peak power output between your first and last reps.
- Why it matters: Peak power represents your maximal neuromuscular recruitment. A sharp decay here shows a loss of explosive speed and motor unit recruitment.
In my observations this is the single most sensitive factor to fatigue with a drop off starting pretty much after the first maximal effort.
3. The Math: How It Is Calculated
SwiftMo uses linear regression to calculate a best-fit trendline across your reps for each of the three metrics. The slope of this trendline determines the decay:
- Calculate the raw slopes: Using the rep sequence as x=[0,1,2,...] and the power metrics (in Watts or W/kg) as y, the system computes the slope (m) of the regression line:
m = n ∑ ( x y ) − ∑ x ∑ y n ∑ ( x 2 ) − ( ∑ x ) 2
- Inverting for "Decay":
- For Concentric Power and Peak Power, a downward slope (negative m) represents fatigue. To display this as positive decay, we invert it:Concentric Decay = Concentric Slope × ( − 1 ) Peak Power Decay = Peak Power Slope × ( − 1 )
- For Eccentric Power, the raw slope is kept as-is to represent recovery control.
- Total Performance Decay: The three metrics are summed together to create the final index:Performance Decay = Peak Power Decay + Concentric Decay + Eccentric Decay
4. How to Interpret the Scores
| Score Range (Decay Index) | Colloquial Mapping (Effort Level) | Practical Interpretation |
|---|---|---|
| Negative (< 0) | Too Easy | Paradoxical Improvement: Your power output actually increased as the set went on. This is common during warmups (due to post-activation potentiation/PAP) or if you paced yourself early in the set. |
| 0 to 20 | Easy | Minimal fatigue. The weight is too light, or you stopped the set far too early to trigger adaptation. |
| 21 to 45 | Moderate | Moderate fatigue. Suitable for endurance or recovery sets. |
| 46 to 65 | Hard | The Adaptation Zone: Significant fatigue is accumulating. This is the sweet spot for hypertrophy and strength gains. |
| 66 to 85 | Very Hard | High fatigue. You are pushing close to task failure. |
| Above 85 | Exhaustion | Complete exhaustion. neuromuscular capacity has been fully depleted. |
5. Visualizing the Slopes
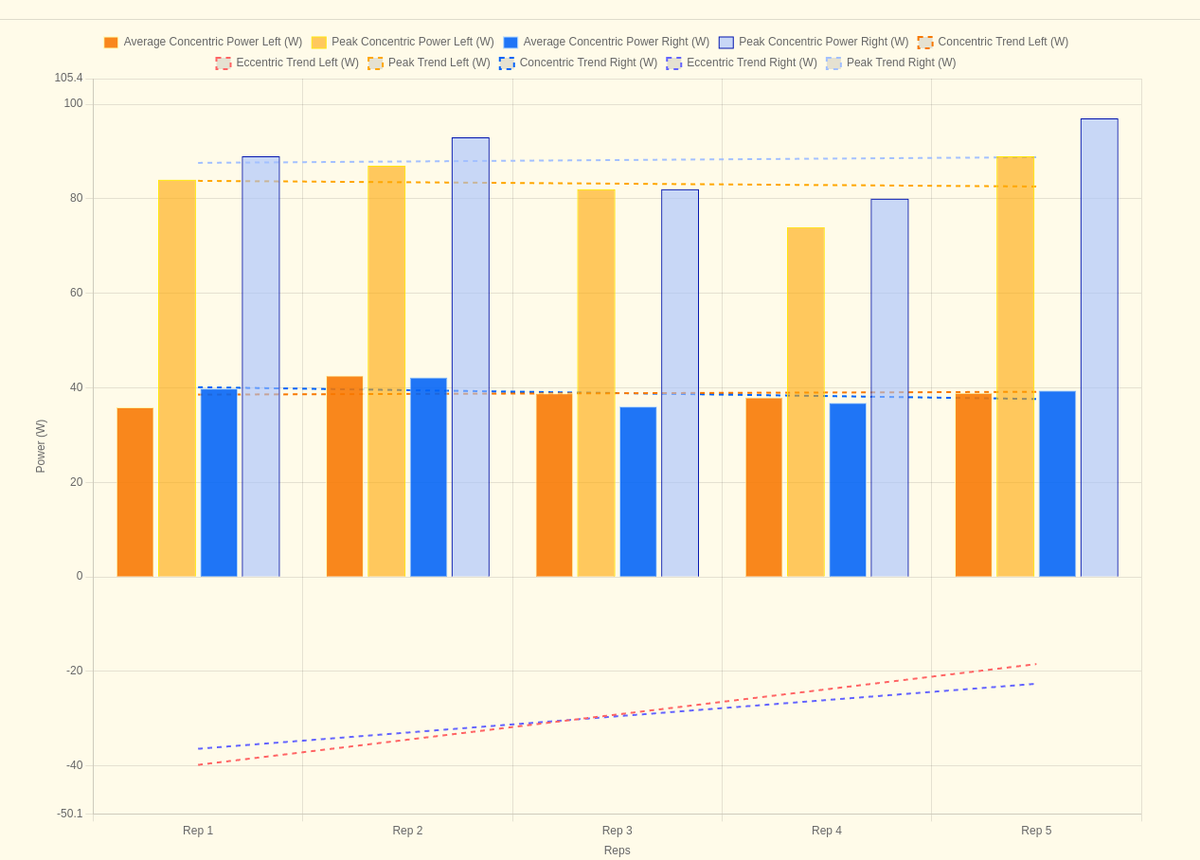
To make these calculations intuitive, SwiftMo Power overlays dashed Linear Regression Lines directly on your session bar charts:
- Concentric Trend (Teal/Orange): Shows the decay slope of your lifting power.
- Peak Trend (Purple/Light Orange): Shows the decay slope of your instantaneous peak power.
- Eccentric Trend (Pink/Red): Shows the slope of your recovery control.
A steeper downward angle in these dashed lines corresponds directly to a higher Performance Decay index and a more demanding Effort Level.